jeudi 2 novembre 2017
dimanche 29 janvier 2017
What Buying Olive Oil In Italy Can Teach You About Value & Price
- Oscar Wilde, The Picture of Dorian Gray
While Wilde wasn’t talking about investing when he wrote this, it does make me think about the difference between the price of a stock versus the value of it.
If you’re reading this, you’ve undoubtedly spent time in the stock market and know that value and price are two very different measures arrived at by different means.
But that begs the questions, how do you know the value of a stock, and how do you know when to buy a stock that’s undervalued?
Sven Carlin, the analyst who writes our free newsletter Investiv Daily, set out to answer these questions in a fantastic article published this past Thursday, and I’d like to share it with you today.
In addition to Investiv Daily, we will soon be launching a new newsletter written by Sven, Global Growth Stocks. This paid newsletter will deliver a stock pick each month that has global market exposure and is on the verge of major growth that you can buy into now for a great value.
If you’re interested in learning more about Global Growth Stocks, I encourage you to add your name to the list via the link at the bottom of this article to receive updates on its upcoming release.
For those who do sign up for these updates, we will soon be giving you an opportunity to subscribe to Sven’s Global Growth Stocks at an incredible discount and before we release the newsletter to the general public, so keep your eyes on your inbox.
I’ve read through the first few issues of this newsletter, and I can assure you you won’t be disappointed by Global Growth Stocks and Sven’s monthly stock picks.
But enough about that, here’s Sven:
 November 17, 2016
What Buying Olive Oil In Italy Can Teach You About Value & Price
- Everybody knows the price of a stock, but few know the actual value.
- There are a few things that can help you when buying undervalued assets.
- To determine if you’re investing in a good undervalued investment, consider the company’s probability of bankruptcy.
This summer, I was in Italy and buying some olive oil. As we use mostly olive oil in our kitchen, I bought 10 liters of this special oil, enough to last for a few months.
The seller came on a typical Italian scooter with the oil, and told me that the price was 100 Euro. I paid, and the seller and I continued on in a conversation about the sea, sunshine, boats, olives, and oil. The olive oil guy said that he and his family have 600 olive trees, it takes them a month to pick them in the Autumn and he usually gets about 3,000 liters of olive oil. I made the calculation and said that he makes 30,000 Euro a year just on his olives. He then corrected me that he usually sells it to locals for 7 or 8 Euros a liter, and only rarely manages to sell it to a tourist for more.
It was one of those moments in life when I felt both stupid and amazed. He didn’t even realize what he had just told me, he said “Ciao” and left me standing with my 10 liters of olive oil and 100 Euro lighter.
You might be wondering what olive oil has to do with investing. Well, there is a very important lesson to be learned here. I paid 10 Euros per liter because it was a price that reflects the value of the oil for me, what I didn’t know is that the price for locals was much lower.
With a little bit of research, I could have known the exact price of the oil, or what we all learn by watching the stock market. But what’s more important than the exact price of an asset is the value behind the asset we are buying. My olive oil situation is the exact opposite to what usually happens on the stock market, where people know the price of everything but the value of nothing.
How Do You Know The Value Of A Company?
This is the million-dollar question, but the answer can be reached.
In simple words, earnings are what give value to a company. As earnings grow, the value of the company will increase accordingly. The big issue lies in the time frame used for earnings and value. As businesses operate in cyclical economic environments, their earnings fluctuate accordingly. Therefore, Nobel Prize winner Professor Rober Shiller developed the Cyclically Adjusted Price Earnings ratio (CAPE), which uses average inflation-adjusted earnings from the previous 10 years.
The table below includes the 10-year earnings per share data on 5 companies that we’ll name later. Some are stable, and some are more volatile, but their averages are all positive.
 Table 1: 10-year earnings. Source: Morningstar. |
Company A in this case is Rio Tinto (NYSE: RIO). Its price was often above $49.9 in the 10 years, but is currently still below it amidst the commodity bear market.
 Figure 1: Rio Tinto 5-year stock price. Source: Yahoo Finance. |
 Figure 2: JNJ 5-year stock price. Source: Yahoo Finance. |
 Figure 3: MSFT 5-year stock price. Source: Yahoo Finance. |
 Figure 4: GE 5-year stock price. Source: Yahoo Finance. |
 Figure 5: ED 5-year stock price. Source: Yahoo Finance. |
When Should You Act If A Company Is Undervalued?
If the million-dollar question was how to value a company, the billion-dollar question is when to act on a found discrepancy between value and price.
Stock prices are usually below a fair value when there is something negative going on around the company. Unfortunately, this is the time when most people sell instead of buying stocks. By analyzing long term earnings and a company’s future prospects, it isn’t so difficult to estimate the value of the company.
The real question to be answered then should be, will this company go bankrupt? If the answer is no, then it is much easier to buy into a falling stock with high probabilities of nice returns as the sector or economy stabilizes.
A stellar example of this methodology is the Berkshire Hathaway’s (NYSE: BRK) acquisition of Burlington Northern Santa Fe Corporation back in 2009. Buffett seized an opportunity in the economic cycle, and bought the company at a low point for $35 billion. In the meantime, BNSF’s earnings have doubled and BRK has received more than $22 billion in dividend payments. Not bad for a $35 billion acquisition after 7 years.
 Figure 6: BNSF dividend payments to BRK. Source: Bloomberg. |
The main message of today’s article is that there is plenty of time and there will be plenty of opportunities to make smart investments. There is no need to rush into purchases just because the market tells you the price or because you think the price is below the value of something like in my olive oil case.
By buying only when the price is much lower than your assumed value you can sleep better and increase your long term returns.
By Sven Carlin
Sven’s advice at the end of this article is solid: rather than just simply looking at the price of a stock, be patient and look for those stocks that are undervalued. It will require a bit more investigation on your part, but identifying an undervalued stock can result in incredible profits well worth the wait and the work.
I wish you and yours a very happy Thanksgiving this Thursday. Next Sunday we’ll be talking about turkeys. No kidding.
Don’t Be The Turkey...
On this the Sunday after Thanksgiving, ask yourself this question: have you ever considered the holiday to be a “Black Swan” event?I assume most of you answered that question with a “No.”
If you have a turkey sandwich in front of you at this very moment, I apologize, but think about Thanksgiving from the perspective of that turkey you’ve enjoyed so much and ask yourself again if you’d consider the holiday to be a black swan event.
From the turkey’s perspective, Thanksgiving is the black swan event.
From birth, the turkey is fed and protected and fully expects that its lifestyle will continue indefinitely. But then Thanksgiving happens and the turkey ends up roasted and displayed on a platter, never having realized what was coming for it.
If you’re feeling empathy for the turkey right now, again, I apologize, but this exercise isn’t really about the turkey. It’s about recency bias.
We rely on habits every day. We eat the same foods, go to the same places, have the same schedules and behaviors day in and day out.
Habits, of course, make things easier for us, but our habit of having habits does something else to us called recency bias.
Humans are inclined to use our recent experiences as a baseline for what will happen in the future. This bias works just fine in our day-to-day, but when it comes to investing, it can trick us into making decisions we might not otherwise make.
Sven Carlin, the weekday contributor to our newsletter, recently wrote about recency bias in an article that asked readers to question if their brains were wired for investing. I encourage you to read his article.
Sven cautions against relying on your recency bias in your investing and encourages readers to instead think in probabilities.
When the market is up—hello seven year bull market—we become convinced that it’ll never end and risk too much blindly assuming that the black swan event will never come.
Like our turkey from the beginning of this article, who bets everything on life continuing to be good without realizing Thanksgiving is approaching, investors bet everything on a market they think will climb forever without ever realizing the probability of the next big crash is increasing and that crash is around the corner.
Likewise when the market is down, we become certain that it will never climb back up. We cash out our portfolios and hide the cash in our mattress because recency bias tells us the market isn’t going back up.
Then we’re left sitting on a mattress filled with money that isn’t earning anything, missing the opportunity right in front of us.
Now this isn’t about predicting the timing of the next crash. It’s about thinking about the probability of the next crash and preparing accordingly.
Instead of considering as many factors as possible, and realizing that the market goes up and down, we get stuck in our recency bias rut and keep acting as though the situation we’re in now will never end.
But if we take the long view, recognizing that this bias exists, and prepare ourselves for the next crash or climb, we’ll be ready to take advantage of whatever market situation we find ourselves in.
Don’t be the turkey and stop letting habits and yesterday’s experience be what determines what you do with your money tomorrow.
Why The Oil Euphoria Won’t Last
This past Wednesday, OPEC finally reached consensus on oil production cuts agreeing to collectively reduce output by 4.5%, or 1.2 million barrels a day.This sent oil prices soaring. By the close of the market Wednesday, crude prices had rallied over 9%—the biggest one day gain since February 12—and oil and gas producers had accounted for all of the day’s 10 best performers in the S&P 500.
But the euphoria surrounding this announcement that’s pushing prices higher won’t last.
The aim of the cartel’s production reduction are two fold: to end the oil supply glut and to get barrel prices rising again.
This new output reduction deal is contingent on both OPEC members living up to the agreement, and on the cooperation of non-OPEC oil producing countries. Countries like Russia and the U.S.
Despite prices still being less than half what they were just 2 years ago, prices have jumped from where they were at the start of the year, which will only make U.S. shale producers more eager to drill. It’s anticipated that U.S. shale fields could raise production within 4 months, with Texas coming online sooner to capitalize on its $900 billion Permian Basin.
Russia has said that it will cooperate with OPEC and reduce its output. The problem with this is that Moscow is notoriously hard to predict, and considering how much low oil prices have impacted the Russian economy, it isn’t hard to imagine a scenario where Russia takes advantage of marginally higher barrel prices, agreement be damned.
These two players aside, Morgan Stanley also sees an increase in investment from Asia to the North Sea, which will limit oil’s upside even further.
With the OPEC agreement taking affect on January 1, 2017, what I imagine we’ll see is oil advancing to around $60 per barrel early in the year, however, the reduction is only in effect for 6 months after which either OPEC members will agree to extend the agreement because the glut is still there as a result of the rest of the world not reducing output in the first six months of the year, or they won’t extend the agreement and soon after the glut will return in force. Either scenario will have oil retreating back to $50 per barrel by the end of next year, or potentially even slumping down into the $40 range.
Perhaps the agreement’s short time frame is a clever trick OPEC hopes will limit the upside for non-members inhibiting market-share gains especially in the U.S.
But taking a step back, with all things considered, the size of the cut, the timing of it, and the length of time of the reduction is all somewhat trivial in a 96 million barrel per day marketplace with or without non-OPEC member cooperation.
As the agreement doesn’t go into effect until the start of 2017, it’s member countries have been ramping up production in anticipation. Saudi Arabia’s production has increased to well over 10 million barrels per day. Other OPEC countries have followed suit—including Iran which is trying to reclaim its global market share and clout within OPEC that it lost under the western sanctions related to its nuclear program—making the glut far worse before the agreement goes into effect and setting it up to be less meaningful.
The 4.5% cut in production is a great headline, but adherence by member countries isn’t a given. The three big Persian Gulf producers, Saudi Arabia, Kuwait, and the United Arab Emirates, account for roughly 60% of the cuts and are expected to adhere fairly closely to it. But the other member producers may not adhere as closely to their production limits, and without that adherence, the cuts don’t have much teeth.
So it seems as though OPEC’s agreement is just noise meant to bring movement to crude oil prices in the short term, and drive a sentiment shift in oil and energy stocks.
The big problem with this strategy is that it is so focused on the short term. The glut will still exist, and its doubtful prices will ever rise to where they were two years ago. And the big problem with all of this supply, and part of the reason why the glut of oil exists in the first place, is that the demand just isn't there.
While it’s true that the glut in oil can be partially attributed to OPEC member states’ unfettered oil production since 2008—the last time a production output reduction was put in place—it’s also true that with rise of electric and more efficient gas-powered passenger vehicles, and solar and wind power, oil demand has begun to slow enough to make even the chief financial officer of Royal Dutch Shell, Simon Henry, predict that we’ll reach peak oil demand within 5 to 15 years.
Even the International Energy Agency (IEA) thinks oil demand from passenger cars, the biggest users of oil, has already peaked. In the IEA’s World Energy Outlook released in November, it doesn’t imagine the global demand peak coming before 2040, but their forecasts have underestimated growth in the renewables industry for the past decade causing me to think their forecast is a little too optimistic for oil and energy companies.
Add to this that global trade has already plateaued and it’s possible that with the rise of nationalist leaders such as President-elect Trump, we’ll see further declines in trade, reducing the demand for oil from the freight and maritime sectors.
Between the rise of electric passenger cars and renewable energy such as wind and solar, and the decline in demand from global trade, it’s hard to envision where demand will come from for oil. While it’s expected that emerging markets will drive future demand growth, I have to wonder if these markets will be able to drive it fast enough to depress the other apparent trends.
What it all comes down to is that in the long term, oil really doesn’t seem like a safe bet. And to me, it feels a bit like OPEC is fighting against history.
Having said that, though, I do believe that with all of this OPEC noise, there are some opportunities in the short term.
One such opportunity is U.S. Silica (SLCA).
I like SLCA because, while it’s in the oil and energy sectors, it isn’t dependent on producing fuel for passenger cars, the area where peak oil demand has already been reached. Instead, SLCA manufactures commercial silica used for fracking and other industrial processes.
Beyond its operations in the oil and gas industry, it also provides silica products for use in plastics, rubber, cleansers, paints, sealants, and fiberglass and other textiles. With its spread across these segments, when peak oil demand is reached in the coming years, SLCA won’t be in the kind of trouble pure oil producers will be.
SLCA has done really well this year. It bottomed out of a multi-year downtrend at the beginning of this year, rising from the low teens to just over $51 per share as I’m writing this.
Typically I wouldn’t recommend a stock that has been steadily rising like this one has, but I still think there is a fair amount of upside to SLCA and this week it set up an interesting opportunity.

Looking at SLCA’s chart over the last couple of months, you can see that this week it broke out of a correction, making for a great entry point for a breakout trader.
Furthermore, if the price can rise above its all-time high of $73.43—roughly 30% above where it is now—there is no more overhead resistance for SLCA.
You have to anticipate a correction before it gets there, but if you place a stop loss around $48 - $49—its low at the beginning of this week—and adjust that stop loss as the price rises, you should mitigate the risk.
Bottom line, betting on oil in the long term isn’t such a great idea. With demand weakening, oil and gas stocks won’t be a safe place to have your money within a few short years.
But there are opportunities in the short term, and companies like SLCA are a safer option than pure oil plays that are still benefitting from all the OPEC noise.
Defense Stocks Are Hot, But Think Twice Before Investing
I came across several news stories this week about global defense expenditures rising from $1.55 Trillion in 2015 to $1.57 Trillion this year, a substantial rise that reflects various geopolitical risks and uncertainties.Immediately after reading a few of these stories, I looked at the charts for several defense stocks.
As I assumed they would be, all were on the rise. They had all been climbing for months.
When I sat down to write this article, I checked them again. And again as I suspected, prices had started to fall. Just days later.
Let’s take a look at Boeing (NYSE: BA):
 When I checked Boeing’s chart on Tuesday, it was gaining, rising as high as $160.07.
When I checked Boeing’s chart today, Thursday, it had fallen, closing at $153.77.
This phenomenon—a stock rising for months in anticipation of an event then peaking on a news report and falling shortly after—is a perfect example of the old adage:
Buy the rumor, sell the news.
What this means is that, as a rumor starts to spread of an event or
announcement, whether through media or insider gossip, traders buy the rumor
as though the event or announcement has already happened. In other
words, they build the event into the price of the stock in anticipation
of an event leading to a rising stock price.When the event or announcement happens, the trading catalyst is in the past and the traders who drove the price higher in anticipation sell their positions and the stock falls.
Traders familiar with this pattern can make huge gains anticipating this type of trend, but that’s easier said than done.
The reason is that once the event or announcement takes place, less-experienced traders are temped to hold onto to the stock because the event added value to the company, forgetting that it was already priced into the stock well before the event ever happened, then finding themselves in a losing position.
But if you recognize the pattern and pay attention to the rumors, and can put aside your emotions to avoid the mistake of holding on too long, you can do quite well.
In our example with defense stocks, rumors about increased global expenditures began circulating in April of this year.
If we take Boeing again as our example, its stock price closed at $126.96 on April 1. If you had invested then and sold at the top on Tuesday at $160.07, you would have made 26% on your investment, catching the upside of the anticipatory trend and truly buying the rumor and selling the news.
But since we’re now past the catalyst—the announcement that global defense expenditures have risen—what is there to do?
Considering the geopolitical risks that pushed defense spending higher are still present—and that the U.S. has just elected Donald Trump, who has promised to increase military spending in the nation with the highest military expenditures by far—it wouldn’t be surprising if defense stocks continue to rise.
If we compare a handful of defense stocks, we can see that they have all been on a pretty steady climb since 2009.
 Realistically, most of these stocks are overvalued. Instead of buying
defense stocks now after the news that military spending is increasing
world-wide, wait for a correction and better valuations.
Realistically, most of these stocks are overvalued. Instead of buying
defense stocks now after the news that military spending is increasing
world-wide, wait for a correction and better valuations.It’s clear that after the Tuesday high this week that these stocks have started to come down, and this may be the beginning of a correction that would make defense stocks more attractive.
I’ll be keeping an eye on General Dynamics (NYSE: GD). General Dynamics has a healthy dividend, and isn’t as overvalued as some other defense stocks.
Defense revenue accounts for roughly 60% of GD’s total revenue, and the company is also exposed to the steadily growing market for private jets.
Considering its lower valuation relative to its peers, and that the company is exposed to a potential continuation of the ramp-up in military spending, I think it’s likely that the stock will outperform.
General Dynamics also boasts a strong balance sheet and has widened its operating profit margin since 2013, a trend I expect will continue on in the next several years.
Keep an eye on defense stocks and wait for a correction as it will make for a great buying opportunity in a sector that is sure to continue its climb.
As for that old adage, pay attention and watch for rumors. If you read something enticing, do some research to verify the beginning of a trend and get in on it early. And don’t forget to ditch your emotions and sell when the news finally breaks.
This 1 Chart Proves Dow 50,000 is Inevitable
Dear Reader,
Take a good look at this chart of the stock market dating back to 1897…
Take a good look at this chart of the stock market dating back to 1897…
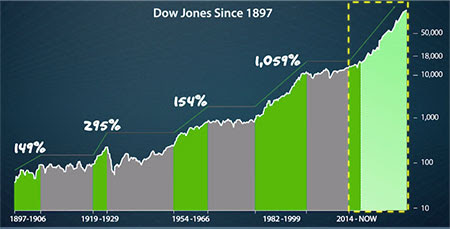 |
See the repeating pattern?
Bull market … bear market. Bull market … bear market…
For the last 120 years, this pattern has never been interrupted. And right now this pattern proves that we are entering a new bull market.
According to Wall Street legend Paul Mampilly…
“This chart proves that this next bull market will be bigger than
every other bull market in U.S. history … combined!
The Dow is going to 50,000.”
every other bull market in U.S. history … combined!
The Dow is going to 50,000.”
In fact, he accurately predicted the 2000 and 2008 collapses well in advance … helping him make $38 million in the last stock market crash alone.
In a new video, Paul breaks down this chart and explains exactly how everything will rapidly unfold as this new bull market mints more millionaires than any other time in history.
In fact, Paul has three stocks that he says you should buy today … stocks that could be the next Wal-Mart, JDS Uniphase and Dell, which made investors 27,504%, 28,894% and even 91,863% during the last bull market.
But hurry … the stock market is already hitting new highs.
You need to buy these stocks now.
"Artificial Intelligence" Is Crushing
Buy And Hold Investing
Dear Reader,
What I’m about to share with you might come as a complete shock but it’s absolutely true.
Did you know that the most profitable investing strategy ever has nothing to do with company or market fundamentals?
In fact, one
Ph.D. of finance Cliff Asness discovered this market beating phenomenon
back in 1994 while completing his thesis at the University of Chicago.
Today he has built one of the fastest growing hedge funds in the world amassing $42 billion in only 13 years.
But he wasn’t
the first to discover this incredible secret. There are a handful of
ultra-wealthy, cutting-edge traders who started using it long before
1994.
Their annual compound returns are simply mind boggling, far surpassing those of Warren Buffett, Carl Ichan, and David Tepper.
For example...
Ed Seykota turned $5,000 into over $15 million in only 15 years (300,000%)
Michael Marcus turned $30,000 into over $80 million (266,000%)
And John Henry used it to become a billionaire and now owns a stake in the Boston Red Sox.
Their strategy is very “unorthodox.”
They don’t care about balance sheets, P/E ratios, or return on equity.
If you ask them, they might chuckle and tell you none of that stuff
matters.
All they care
about is price and price trends. That’s right, each one of these traders
made their fortune as a trend following momentum based trader allowing
price to dictate all of their trading decisions.
So how can you put a trend following strategy to work in your portfolio?
In today’s computer-driven world it’s virtually impossible for the average investor to trend follow without the aid of a computer algorithm that detects early… and lasting trend changes.
There are simply
too many variables to track to know which companies are seeing unusual
institutional money flows, which is what creates sustainable and fast
rising stock prices.
My business partner Jesse Webb is an expert trend-following trader with 20 years experience. Prior to Co-founding Investiv, he managed money for high net worth individuals at one of the largest banks in the country.
His experience at the bank gave him an inside knowledge into how institutions think, allocate money, and make trading decisions.
Armed with that data he spent 10 years and over $500,000 developing a web-based computer-driven algorithm which tracks institutional money flows and alerts subscribers to the strongest trending stocks in both bullish and bearish markets.
Inscription à :
Articles (Atom)